Results of the 2004 US presidential election at the county level (sf)
USelect2004.rdResults of the 2004 US presidential election at the county level, together with five socio-economic (census) variables. This data can be used with GW Discriminant Analysis.
Usage
data(USelect2004)Format
A sf with 3111 electoral divisions on the following 6 variables.
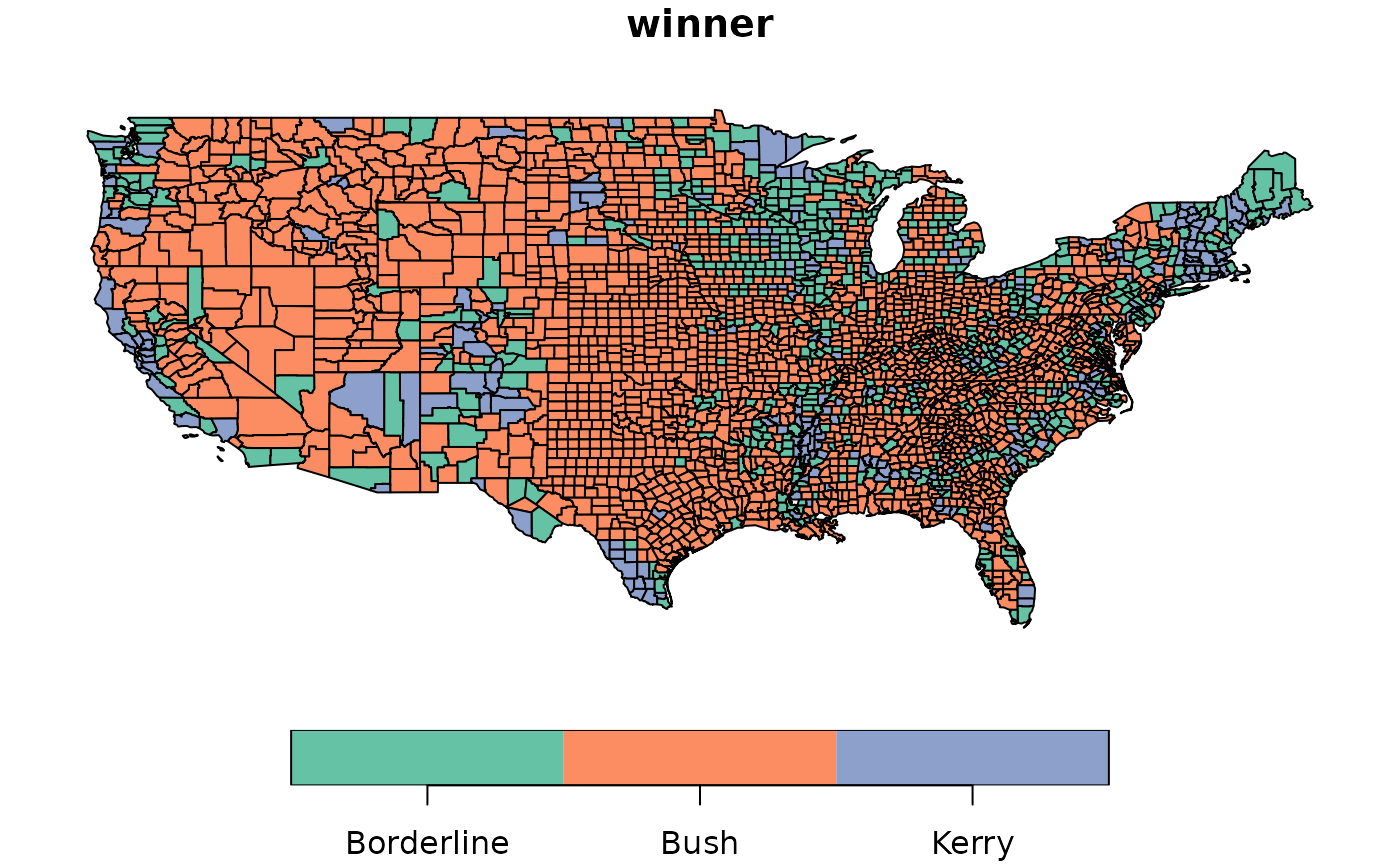
- winner
Categorical variable with three classes: i) Bush, ii) Kerry and iii) Borderline (supporting ratio for a candidate ranges from 0.45 to 0.55)
- unemploy
percentage unemployed
- pctcoled
percentage of adults over 25 with 4 or more years of college education
- PEROVER65
percentage of persons over the age of 65
- pcturban
percentage urban
- WHITE
percentage white
References
Robinson, A. C. (2013). Geovisualization of the 2004 Presidential Election. In: NATIONAL INSTITUTES OF HEALTH, P. S. U. (ed.). Penn State: http://www.personal.psu.edu/users/a/c/acr181/election.html.
Foley, P. & Demsar, U. (2012). Using geovisual analytics to compare the performance of geographically weighted discriminant analysis versus its global counterpart, linear discriminant analysis. International Journal of Geographical Information Science, 27, 633-661.